


![[Upcoming Webinar] Addressing the Wind Industry's €25 Billion Annual Wake Loss Problem](https://www.windesco.com/hubfs/Swarm%20webinar%20cover%20image.png)


New WMO analysis underscores 2024’s solar anomalies
In a new weekly update for pv magazine, Solcast, a DNV company, writes that while findings from the The European State of the Climate 2024 report align with its own solar analysis covering last year, differences in anomaly magnitude between the two datasets stem from the climatology periods used.
In a new weekly update for pv magazine, Solcast, a DNV company, writes that while findings from the The European State of the Climate 2024 report align with its own solar analysis covering last year, differences in anomaly magnitude between the two datasets stem from the climatology periods used.
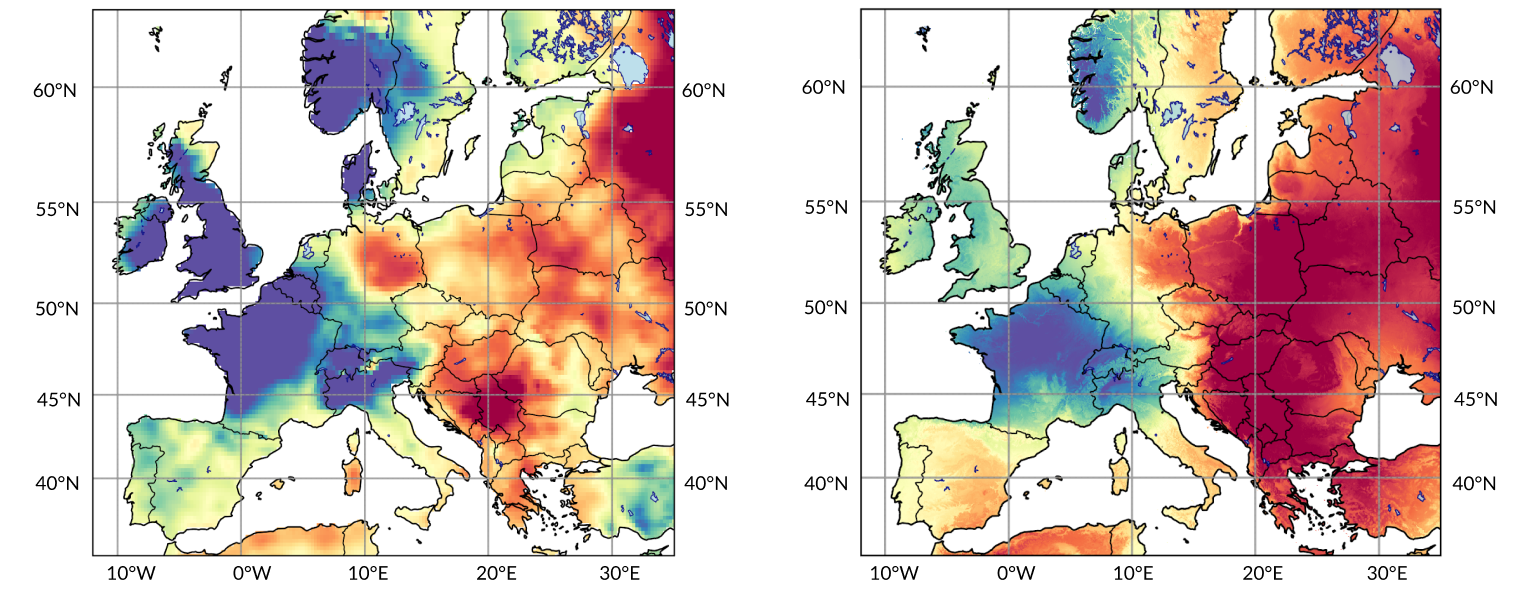
The European State of the Climate 2024 report, jointly produced by Copernicus Climate Change (C3S) and World Meteorological Organization (WMO) using ECMWF (European Centre for Medium-Range Weather Forecasts) data, has confirmed a year of extremes, with 2024 officially declared the warmest year on record for the continent. Among its findings is a detailed assessment of solar conditions across Europe, including sunshine duration anomalies that highlight a long-term positive irradiance trend as the climate changes, and a 2024 marked by an east/west divide in solar radiation.

These findings align with 2024 solar analysis using the Solcast API published in January, which revealed a similar east/west divide in solar irradiance anomaly across Europe in 2024. Despite methodological differences, both analyses point to a similar geographic distribution of solar anomalies, reinforcing the broader climate signal observed throughout the year.
The difference in anomaly magnitude between the two datasets primarily stems from the long-term (climatology) periods used. The WMO’s analysis is based on a 1991–2020 baseline, while Solcast uses a more recent 2007-2023 period that relies on modern high-resolution satellite imagery. Because of the positive trend in solar irradiance over time, using a more recent climatology results in a slightly different anomaly – not because the data disagrees, but because today’s “normal” is rapidly shifting. Older baselines include decades of cooler conditions, which lowers the average and changes the perceived anomaly.
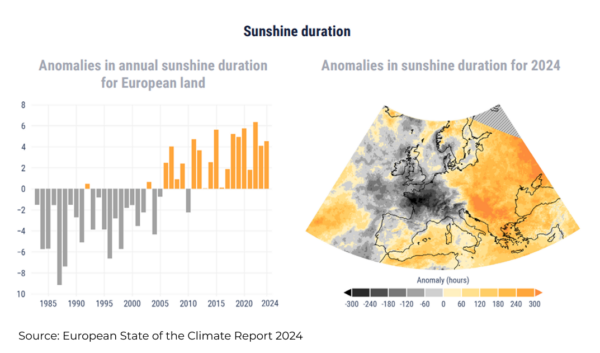
Whilst not the same measure as the above anomalies, the below ‘sunshine duration’ map from the same WMO report, clearly demonstrates the impacts a changing climate can have on solar resource availability.
This difference highlights an important consideration for solar operators and energy planners. Long-term records remain valuable for tracking climate change but when modelling solar performance, data needs to reflect current conditions. Long-term averages are a useful tool in resource assessment and design but analysts need to be aware of the effects of climatic trends. The consistency between ECMWF and Solcast findings, despite methodological differences, reinforces the need for up-to-date datasets that capture the most recent trends.
With solar performance increasingly influenced by evolving climate signals, access to accurate, timely data is becoming critical. As 2024 shows, assumptions based on outdated baselines risk misrepresenting current realities. Looking forward solar planning must be grounded in data that reflects where we are now and where we are heading, not where we were thirty years ago.
Solcast produces these figures by tracking clouds and aerosols at 1-2km resolution globally, using satellite data and proprietary AI/ML algorithms. This data is used to drive irradiance models, enabling Solcast to calculate irradiance at high resolution, with typical bias of less than 2%, and also cloud-tracking forecasts. This data is used by more than 300 companies managing over 150GW of solar assets globally.
What's Your Reaction?